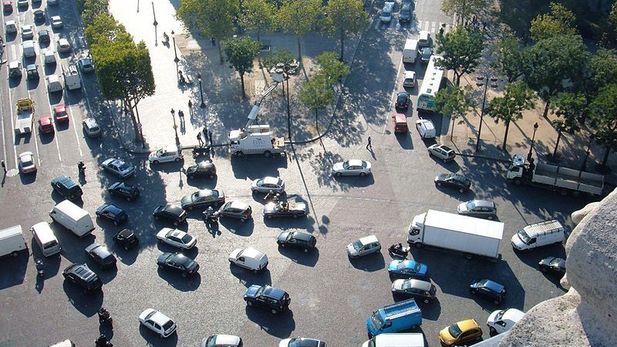
You’d think that the business hub of Gauteng would be the most congested area in South Africa, but it turns out that Cape Town is the leader in this regard. Satellite navigation specialists, TomTom, has released its annual Traffic Index highlighting the impact of traffic congestion in over 200 cities around the world.
The report shows a global trend of evening rush hour being the most congested time of day with bottlenecks nearly doubling journey times. In 2014, the average commuter spent an extra 100 hours a year travelling during rush hour. In South Africa, things are a little different, as the morning has been proven to be the busiest. On a global scale, “Cape Town remains the most congested city at 55 on the list, with morning commutes adding up to 72% to commuting time. Joburg listed at 77 is not much better with a morning travel adding up to 59% to commuting time. The evening Cape Town has the worst congestion level in SA adding 58% to travel time and Johannesburg adding 54% to travel time.”
Pretoria has leapfrogged East London as the third most congested city in South Africa, with overall congestion level of 24%. Interestingly for Gauteng, the busiest traffic day was 3rd February 2014, thanks to floods due to bad weather. What does this mean? According to TomTom’s calculations, this means commuters are spending up to 11 days per year sitting in traffic. Internationally, the three most congested cities are Istanbul, Mexico City and Rio De Janeiro.
TomToms mission is to reduce traffic congestion for everyone, says Carey Dodd, Marketing Manager for TomTom SA. Road authorities and local governments can use TomToms traffic data to better manage traffic flow during the rush hour. We can help businesses plan smarter working hours to help their employees avoid travelling during rush hour. And we give drivers the real-time traffic information and smart routing they need to avoid congested roads and get there faster.
Most Congested City Rankings
Overall ranking of most congested South African cities in 2014: (Average of morning and evening congestion)
| World rank (based on overall congestion level) | City | Evening peak congestion level | Morning peak congestion level | Overall congestion level |
|---|---|---|---|---|
| 55 | Cape Town | 58% | 72% | 29% |
| 77 | Johannesburg | 54% | 59% | 26% |
| – | Pretoria | 47% | 52% | 24% |
| – | East London | 42% | 45% | 23% |
| – | Durban | 39% | 42% | 19% |
| – | Bloemfontein | 24% | 25% | 13% |
Overall ranking of most congested cities in 2014: (Average of morning and evening congestion):
| World rank (based on overall congestion level | City | Evening peak congestion level | Morning peak congestion level | Overall congestion level |
|---|---|---|---|---|
| 1 | Istanbul | 109% | 76% | 58% |
| 2 | Mexico City | 89% | 93% | 55% |
| 3 | Rio de Janeiro | 81% | 72% | 51% |
| 4 | Moscow | 103% | 77% | 50% |
| 5 | Salvador | 75% | 62% | 46% |
| 6 | Recife | 82% | 81% | 45% |
| 7 | Saint Petersburg | 96% | 67% | 44% |
| 8 | Bucharest | 82% | 78% | 41% |
| 9 | Warsaw | 75% | 69% | 40% |
| 10 | Los Angeles | 80% | 60% | 39% |